In 1981 there was a significant real estate market bubble. Back then, home buyers were faced with skyrocketing interest rates nearing 20%, and an annualized inflation rate of 12.5%. The unemployment rate was at 13%. This was the baby boomer period that saw a rise in demand for real estate.
The housing prices at that time were of course almost 1/10th of what they are today, but the baby boomer bulge that stampeded into the housing market was also faced with increased closing costs. More than 20% of the homes bought were sold within 6 weeks, indicating a number of investors trying to realize a profit though a quick flip. A profit they wouldn’t see for years to come. The demographic shift led to prices being pushed up, and we can see afterwards from 1981 the market cooling off, or the bubble bursting. The market softened for about 7 years before it saw another significant spike.
1990
This year saw a drop of sales ranging from 20-25%. Those who invested back then, could only now realize an appreciation of their asset up to 5.3%. Interest rates in 1990 were also very unfavourable, topping somewhere near 14-15% for 1 and 5 year mortgage rates. The average price for a home was about $220,000-230,000. When the housing bubble burst, there was a national default rate of 0.28%.
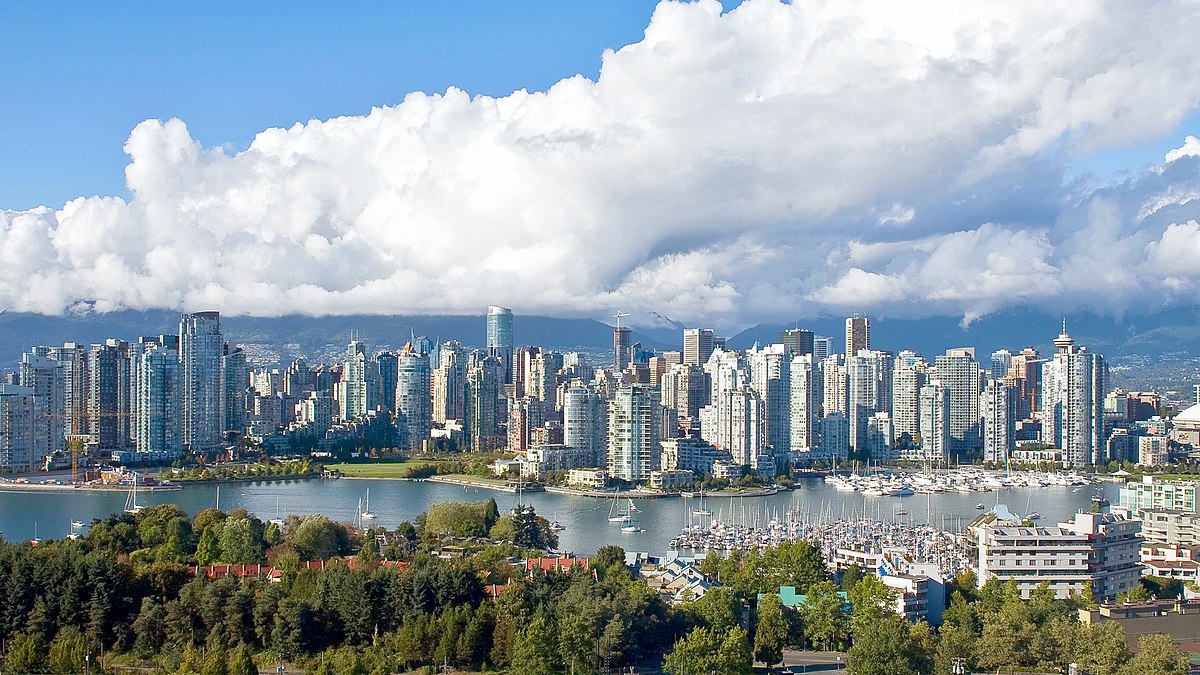
1990 was also the beginning of an increasingly strong housing market. Vancouver’s population as shown on the graph began to rise. It is estimated that about 14% of the properties bought at that time were sold within 6 weeks, indicating another frenzy of flipped properties and increased prices. The index of affordability was near 65%. There was a less dramatic jump in average prices compared to 1981, and a more modest levelling off until mid 1990’s.
1998
The housing market around this period was faced with a number of issues. The leaky condo crisis and the Asian Contagion both played a major role in Vancouver’s real estate market. MLS records have shown the number of sales only amounted to 16,000. Although 1998 was the beginning of a steadily increasing upswing, we will take a look at what brought the market into a slump.
Real estate prices peaked in 1995 and the market saw a correction in the following four years. The market activity was exacerbated by the world economic environment. The ‘Asian Contagion’ began in Japan when lending institutions were stuck with bad loans. They were slow to react and couldn’t take decisive action.
An inflation bubble occurred and they went into deep recession that also hurt overseas investors who held investment securities, and their economy went bust. The Asian financial crisis triggered the Russian financial crisis, and this domino effect brought worldwide economic trouble. We can see on the graph that around that time, real estate prices had bottomed out.
The leaky condo crisis also brought demand down for detached homes, as households weren’t able to sell their condos and afford to make such a move. The world economy crisis led developers to capitalize on the market taking a dive, which in turn led to the reduced quality of housing structure.
They didn’t build up to code which caused water to ingress through the roof, on top of unsuitable installation of membranes around the building envelope. This problem cost millions of dollars, forcing owners to shell out nearly $70,000 which they couldn’t afford.
1999-2008
Instead of isolating a specific year between this time period, it would be more functional to analyze all the events that led to a massive increase in home prices that we now face today. After the events surrounding 1998, there was a lot of pent up demand for housing that started a chain reaction with homebuyers.
Sales of detached/ attached homes, and apartments increased 16% within a year, leading to a healthy recovery in the resale housing market. Interprovincial migration was also a factor in increased market activity, a net flow BC hasn’t seen for two years. In 2001, the Federal Government decreased capital gains taxes from 75%-50% to promote investing and increase sales volumes.
In 2004, Greater Vancouver’s real estate market was impacted by record breaking activity. The continuing pent up demand, low interest rates, and word that Vancouver won the bid for the 2010 Olympics put the GVRD on the map as one of the hottest real estate markets to invest in, especially in Canada. All of this activity led to a burst of new home construction, seeing a 33% increase over the same period the previous year, or more significantly, a 137% spike from five years ago.
In fall of 2007, real estate prices were at its peak. The benchmark price for a detached home was at an unheard of $771,250 according to MLS Link Housing Price Index. Sales in 2007 were upwards of 38,000. As we can see on the Real Estate Board of Greater Vancouver’s graph, the average home price for 2008 was $825,206.
Vancouver’s growing economy, rising incomes, increased immigration, and higher employment had the market in a healthy position, but it began to cool down in the following months. The GVRD is still bound by its limited land base, surrounded by mountains, water and agricultural land reserve. The recession is also a determining factor as to why the prices are beginning to level off, and affordability is marginally improving as we enter a buyer’s market.